The S&P 500 is the closest thing finance has to a universal remote. You can point it at the U.S. stock market,
hit “power,” and instantly get a read on what Wall Street thinks about growth, inflation, tech trends, consumer moods,
and whether everyone collectively woke up and chose optimism (or chaos).
But the S&P 500 didn’t start as a cultural iconor a daily headline generator that can ruin someone’s lunch with a
two-percent dip. It began as a practical attempt to measure the market with more accuracy than “my neighbor says railroads
are doing great.” Over time, it became the benchmark investors compare everything to: mutual funds, retirement accounts,
ETFs, hedge funds, and that one friend who insists they’re “beating the market” (but never shows the math).
Before the “500”: Why America Needed a Better Market Scoreboard
To understand the S&P 500, it helps to remember what investing used to look like: fewer computers, slower data,
and a market that was harder to summarize quickly. Early stock averages existed, but they often covered narrow slices
of the market or weren’t updated frequently enough to feel like a real-time pulse.
In the early 20th century, Standard Statistics began publishing stock indices that gradually expanded in scope, including
a broader list of companies designed to represent more of the market than the best-known industrial averages. Over time,
the approach evolved from smaller collections to more comprehensive groupings that could serve as a meaningful benchmark
for investors trying to answer a deceptively simple question: “How’s the market doing?”
The business side of this story matters, too. Standard Statistics and Poor’s Publishing eventually merged, creating the
Standard & Poor’s brand that would become synonymous with market benchmarks. In other words: the S&P 500 wasn’t
created by a mysterious committee in a secret financial bunker. It was built by researchers and index makers trying to
standardize how market performance was measuredand to sell reliable information to investors who needed it.
1957: The Modern S&P 500 Is Born
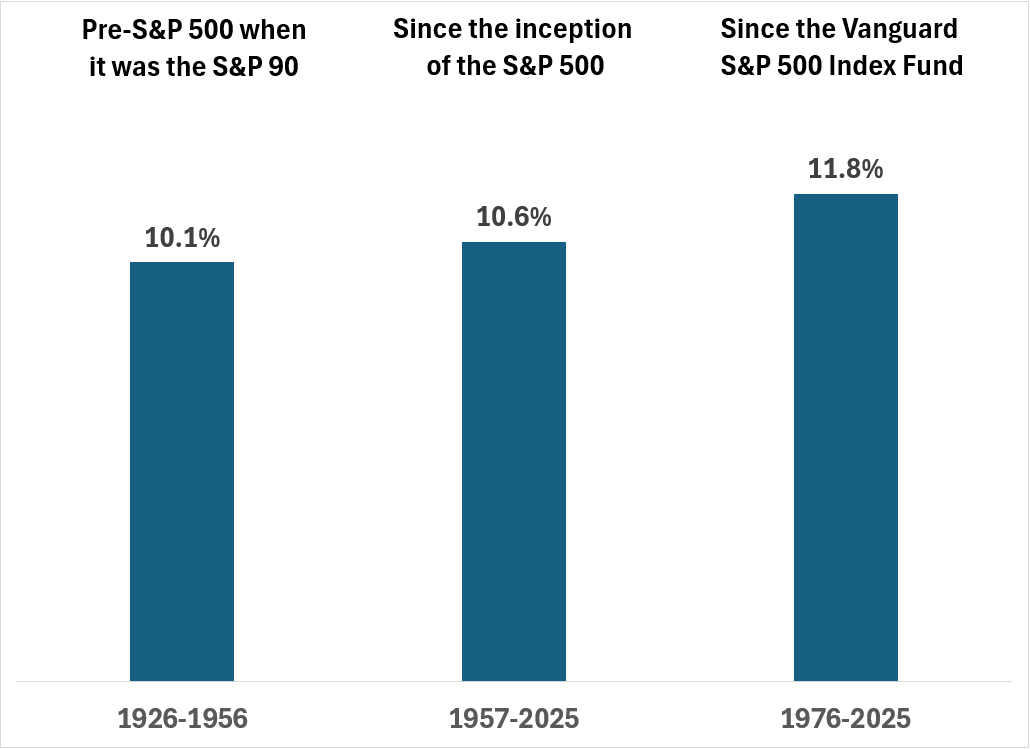
The S&P 500’s “official birthday” is March 4, 1957, when the index expanded to 500 companies and took the shape that
investors recognize today. The idea was straightforward: track a large, diversified set of leading U.S. companies in a way
that could serve as a broad-market indicator. According to a Reuters milestone timeline, the early composition included a mix
of industrial, rail, and utility stocksreflecting what mattered most in the mid-century American economy.
That era’s market leadership looked different than today’s. Utilities and industrial giants carried more cultural and economic
weight. Technology existed, but it didn’t dominate portfolios the way it can now. The index’s job, then as now, was to act like
a mirror: it reflects what the U.S. equity market is, not what anyone nostalgically wishes it were.
One reason the S&P 500 became so influential is timing. The post-war economy was expanding, corporate America was scaling,
and markets were becoming more widely followed. A robust, widely referenced benchmark fit the moment.
What the S&P 500 Actually Measures (And What It Doesn’t)
People often describe the S&P 500 as “the 500 biggest companies.” That’s close enough for casual conversation, but not quite
accurate. The index is designed to represent leading U.S. large-cap companies, but inclusion depends on rules and committee decisions,
not a simple “top 500 by size” list.
Market-cap weighting: The loud companies get the loudest microphones
The S&P 500 is weighted by market capitalization, which means larger companies count more. If a mega-cap company moves 3% in a day,
it can sway the index more than a mid-sized component having a dramatic swing.
This is both a feature and a footnote. It’s a feature because it reflects how the market’s value is distributed. It’s a footnote because
it can surprise people who assume “500 companies” means “perfectly balanced diversification.” The index is broad, but it’s not democratic.
It’s more like a high school cafeteria: yes, there are many students, but a few tables decide what’s “cool.”
Float-adjusted market cap: not all shares are treated equally
Another key detail is float adjustmentmeaning the index weights companies based on shares that are actually available for public trading
(not locked up by insiders or strategic holders). The shift to float-adjusted weighting was implemented in 2005, according to an SEC filing
describing the transition, which affected company weights without changing the basic selection criteria.
A committee with rules (not a roulette wheel)
The S&P 500 is maintained by an index committee that applies eligibility requirements and judgment. Official methodology materials describe
the committee’s role and the index’s fixed company count. Practical summaries also emphasize criteria such as size, liquidity, and profitability,
plus requirements tied to public float and U.S. listing.
The takeaway: companies don’t enter the S&P 500 because they’re trendy on social media. They enter because they meet standards designed to keep
the index investable, representative, and liquid enough for the enormous ecosystem built on top of it.
The S&P 500 as a Living Snapshot of the U.S. Economy
The S&P 500’s biggest trick is that it changes without changing its name. It is always “the S&P 500,” yet the companies inside it evolve as the
economy evolves. That’s part of why it has remained so useful over decades: it updates as the market’s leadership shifts.
From rails and utilities to software and semiconductors
Mid-century America was shaped by manufacturing, transportation, and regulated utilities. Later decades brought consumer brands, then globalization,
then the rise of information technology and platform businesses. Today, the index includes companies across all major sectors, from healthcare and finance
to energy, industrials, and big-tech giants that sell everything from cloud computing to subscription entertainment.
1999: A more modern sector map
Sector definitions also evolved. In 1999, MSCI and S&P Dow Jones Indices developed the Global Industry Classification Standard (GICS), creating a consistent
framework for classifying companies by sector and industry. That framework helped investors talk about the market in a more standardized wayuseful when your
portfolio contains companies that didn’t exist when “phone company” meant a literal phone company.
Milestones That Turned the S&P 500 Into a Financial Household Name
The S&P 500 didn’t become a cultural force solely by existing. It became influential because an entire financial universe formed around it: index funds,
futures markets, and ETFs that made “owning the market” easier and cheaper.
1976: Indexing goes mainstream for everyday investors
In 1976, Vanguard launched what it describes as the first retail index fund, originally called the First Index Investment Trust (now the Vanguard 500 Index Fund).
This was a big deal: it made broad-market investing accessible at low cost and helped popularize passive investing as a long-term strategy.
Indexing also delivered a quiet psychological shift. Instead of asking, “Which stock will win?” investors could ask, “What if I just own the whole race?”
1982: Futures arrive (hello, risk management and speculation)
In 1982, S&P 500 futures launched at the Chicago Mercantile Exchange, creating a fast, standardized way for institutions and traders to hedge market exposure
or express a view on broad U.S. equities. Futures helped turn the S&P 500 from a measurement tool into a tradable instrumentsomething you could actively use,
not just observe.
1993: The first U.S. ETF is bornand it tracks the S&P 500
In January 1993, State Street launched SPY, widely described as the first U.S.-listed exchange-traded fund. It aimed to track the S&P 500’s performance and
gave investors a simple way to buy and sell broad-market exposure throughout the trading day.
If index funds made passive investing practical, ETFs made it frictionless. The market got a new kind of convenience product: diversified exposure with intraday
tradability. Wall Street loves convenience almost as much as it loves acronyms.
Big Market Eras the S&P 500 Has Survived (And Recorded in Real Time)
The index is often treated like a mood ring for the economy, but it’s more accurate to call it a long-running documentary series. It has captured booms, busts,
policy shifts, wars, innovation waves, and the occasional moment when everyone realizes they may have been a little too confident.
The early decades: becoming the default benchmark
A classic milestone: the S&P 500 first closed above 100 on June 4, 1968, according to Reuters’ historical timeline. That number sounds quaint today, but it was
an early sign of how the index would become a reference point investors could rally around.
The 1980s and 1990s: modern finance, faster markets
The 1980s brought new tools and faster trading infrastructure. The 1990s brought globalization and the early internet era, where “technology” went from a sector to
a gravitational field pulling the whole market toward it.
The 2000s: bubbles, crashes, and reinvention
The dot-com bubble showed how market-cap weighting can amplify fast-growing sectors. The financial crisis later revealed how interconnected corporate America had become.
Through it all, the index did what it always does: it fell when the market fell, and it rose when recovery took holdcapturing the drama without editorial commentary.
(The editorial commentary, as always, was provided by everyone on television.)
The 2010s to 2020s: platform giants and headline volatility
More recently, the index has reflected the rise of massive platform companies and the speed at which narratives can move prices. A symbolic moment: in November 2020,
S&P Dow Jones Indices announced Tesla’s addition to the S&P 500, effective before the market open on Dec. 21, 2020an example of how large, newly profitable
companies can reshape the benchmark’s composition.
Why the S&P 500 Has Stayed Relevant for So Long
Plenty of indices exist. The S&P 500 became the index because it sits at the intersection of usefulness, investability, and familiarity.
It’s broad enough to represent the U.S. large-cap market, structured enough to be tracked efficiently, and popular enough that it becomes self-reinforcing:
more funds track it because it’s popular, and it’s popular because more funds track it.
It’s curatedon purpose
The committee structure and eligibility rules keep the index investable. That matters because an index isn’t just a statistic anymore; it’s a foundation for trillions
of dollars in products, strategies, and risk models. Small design choiceslike float adjustment and liquidity requirementshave huge downstream impacts.
It adapts without losing the plot
The S&P 500’s identity stays stable even as its cast changes. That balance is hard. If the index never changed, it would become a museum exhibit. If it changed too
much, it would lose continuity. Instead, it evolves in a way that keeps it representative of “large-cap U.S. equities,” decade after decade.
Common Myths (Because the S&P 500 Has Fans, Critics, and Misquotes)
Myth 1: It’s always “the 500 biggest companies”
Not exactly. Size matters, but selection is based on a set of criteria and committee decisions. That’s why two companies with similar market caps can have different
index outcomesone might meet profitability or liquidity standards while the other doesn’t.
Myth 2: Owning an S&P 500 fund means “no risk”
Broad diversification reduces single-company risk, but it does not remove market risk. The S&P 500 can drop sharply during recessions, crises, or periods of rapid
repricing. Diversified doesn’t mean invincible; it means you’re less likely to be ruined by one bad earnings call.
Myth 3: The index is the economy
The S&P 500 is a powerful signal, but it’s not a perfect mirror of everyday life. It reflects publicly traded, large U.S. companiesand those companies earn revenue
globally. Meanwhile, the broader economy includes small businesses, private companies, wage growth, and things the stock market doesn’t price neatly, like “how stressed
everyone feels at the grocery store.”
What the S&P 500’s History Suggests for Modern Investors
This isn’t financial advice, but history does offer a few durable observations:
- Costs matter. The rise of low-cost indexing happened for a reason: fees compound too, just like returns.
- Concentration comes and goes. Different eras crown different leadersrails, oil, banks, software, chipsoften with dramatic rotations.
- Volatility is normal. The index has been through wars, recessions, bubbles, crashes, and policy shifts. It still exists. That’s the point of a broad benchmark.
- Time is an advantage. Many investors “lose” not because the market is unbeatable, but because impatience is undefeated.
If the S&P 500 has a personality, it’s this: optimistic over long stretches, dramatic in the short term, and always willing to test whether you really meant it when you
said you were a “long-term investor.”
of Real-World “S&P 500 Experiences” People Tend to Recognize
The funny thing about the S&P 500 is that most people don’t “meet” it in a textbook. They meet it in momentsusually emotional ones. A first job with a 401(k).
A family member saying, “Just buy an index fund,” like they’re handing you the secret menu. A news alert that makes your stomach drop before you’ve even had coffee.
For many investors, the first real experience is the beginner’s contradiction: you buy something that’s supposed to be “boring,” and then it immediately behaves like a
caffeinated squirrel. The market goes down for a week, headlines start shouting, and suddenly the calm idea of owning 500 companies feels less like diversification and
more like hosting a house party for strangers. You learn quickly that “the market” is not a polite guest.
Another common experience is the gradual realization that the S&P 500 is a story about change. You look at the top holdings from decades ago and realize the giants
of one era can become footnotes in the next. That’s not a flawit’s the index doing its job. It’s a rolling snapshot of what corporate America looks like right now, not
a hall of fame where old champions get permanent reserved seating.
Some people experience the S&P 500 through milestones that feel oddly personal. The index crosses a round number, and even if you don’t own a single share directly,
it still feels like your team scored. Other times, a major drop turns into an unexpected lesson in behavior: it’s easy to say you’ll “buy the dip” when charts look like
gentle waves. It’s harder when the wave looks like a waterfall and every headline is written in ALL CAPS.
Long-term investors often talk about a quieter experience: the slow, almost boring power of consistency. Contributions go in on schedule. Dividends show up. The market
has great years, terrible months, and stretches where it seems to do nothing except test your patience. Over time, the S&P 500 becomes less like a daily scoreboard
and more like a long-distance training plan: progress isn’t always obvious in the moment, but it accumulates when you stick with it.
And then there’s the “comparison experience,” which is practically a rite of passage. A friend brags about a hot stock. You glance at the S&P 500 and wonder if
you’re missing out. Sometimes you arefor a while. Sometimes the bragging ends quietly. The index doesn’t eliminate envy, but it does give you a steady reference point:
a way to ask, “Am I building wealth, or am I just collecting exciting stories?”
In the end, living alongside the S&P 500whether through retirement plans, ETFs, mutual funds, or simple curiosityteaches a set of repeating lessons: markets move,
leadership rotates, emotions exaggerate, and time tends to reward discipline more often than drama. It’s not the most thrilling character in the financial universe, but it
might be the most useful. Which is a very on-brand American story: practicality wins, and eventually everyone puts it on a t-shirt.
Conclusion
The S&P 500 started as a better measuring stick for a growing stock market. It became the benchmark that defines “the market” for millions of investors, and it stayed
relevant by evolving with the economy it tracks. Its history is a timeline of American business: industrial growth, consumer expansion, tech revolutions, financial stress tests,
and the constant reinvention of what “leading companies” means.
If you want one simple summary: the S&P 500 is not a prophecy, not a guarantee, and not a villain. It’s a remarkably persistent scoreboardone that has kept score through
decades of change, and will probably keep doing so long after today’s “can’t-miss” trends have become tomorrow’s trivia questions.