Most modern weather stations are happy to tell you whether it is rainingas long as your Wi-Fi works, the manufacturer’s cloud is awake, the mobile app still supports your phone, and nobody has decided that yesterday’s free feature should become tomorrow’s monthly subscription.
An offline weather station takes a different approach. The outdoor sensors transmit measurements over radio, your own receiver decodes them, and a local computer stores and displays the results. Internet access becomes optional rather than structural. If the cable modem takes the afternoon off during a thunderstorm, your weather dashboard keeps working instead of displaying a tasteful spinning icon.
One particularly flexible design combines a 915 MHz outdoor sensor array, an RTL-SDR receiver, the open-source rtl_433 decoder, and a Raspberry Pi. This arrangement can capture temperature, humidity, wind, rainfall, solar radiation, and ultraviolet data without using the manufacturer’s gateway or cloud service. A documented version of the project uses an Ecowitt WS90 sensor, converts its radio packets into JSON, maintains local rainfall and trend records, and serves a browser-based dashboard entirely on the local network.
What “915 MHz Weather Station” Actually Means
In North America, many wireless weather sensors operate somewhere within the 902–928 MHz spectrum commonly associated with the 915 MHz ISM band. Under FCC Part 15 rules, compatible unlicensed devices can operate in this range, but they generally must accept interference and cannot claim protection from other lawful users. In other words, the spectrum is shared territory, not your private radio driveway.
It is also important not to treat “915 MHz” and “LoRa” as synonyms. LoRa devices can operate in the North American 902–928 MHz band, but frequency describes where a signal lives, while modulation describes how information is encoded. A commercial weather sensor may use its own short-burst protocol rather than LoRa networking. The WS90 packets in this type of project are received by an SDR and decoded by rtl_433; the sensor is not automatically part of a LoRaWAN or Meshtastic network merely because its packaging says 915 MHz.
Why Build an Offline Weather Station?
You own the historical data
A cloud-connected station may show attractive charts while quietly controlling where the underlying measurements live, how long they are retained, and which export features remain available. A local system can store readings in plain JSON, CSV files, or a compact database. You decide whether to retain three days, three years, or every suspiciously windy Tuesday since installation.
It continues operating during outages
The outdoor sensor communicates directly with the receiver over radio. The decoding, calculations, storage, API, and dashboard run on local hardware. Your router may still provide the local network, but the system does not need a path to the public internet. The reference architecture stores rolling state in a JSON checkpoint, saves daily summaries in SQLite, and presents current conditions through a local web API.
It is easier to integrate
Structured local data can feed Home Assistant, an irrigation controller, a greenhouse monitor, a wall display, an MQTT broker, or a custom alerting service. You might pause watering after measurable rain, warn when wind gusts exceed a safe threshold, or display overnight lows beside the coffee maker. That last one is especially useful when the coffee maker is the only household appliance everyone checks voluntarily.
It reduces unnecessary exposure
A one-way outdoor transmitter does not need your Wi-Fi password. The local dashboard can remain read-only and limited to your LAN. Optional remote access can be added later through a VPN or carefully secured outbound tunnel, but the core station does not need to expose an unauthenticated telemetry API to internet scanners. The reference project specifically warns against publishing its local backend directly to the public internet.
Core Hardware for a DIY 915 MHz Weather Station
1. A compatible outdoor sensor array
The Ecowitt WS90 is a useful example because North American versions transmit around 915 MHz and combine multiple instruments in one outdoor unit. Its sensors cover temperature, relative humidity, ultrasonic wind speed and direction, solar light, UV index, and piezoelectric or haptic rainfall measurement. The solid-state wind and rain systems avoid the rotating cups and tipping mechanisms found on traditional consumer stations, although every sensing method still has calibration and siting limitations.
Regional frequency matters. North American hardware may use 915 MHz, while versions sold for other markets can use 868 MHz, 433 MHz, or another approved allocation. Buy the version intended for your country and configure the receiver to match it. Radio regulations are not a buffet where you choose the frequency that looks tastiest.
2. An RTL-SDR receiver
An RTL-SDR is an inexpensive USB software-defined radio originally descended from television tuner hardware. Instead of producing a television picture, it delivers digitized radio samples to software. With an antenna suited to the target frequency, it can receive signals from weather sensors, thermometers, tire-pressure monitors, utility devices, and many other low-power transmitters.
For this project, the SDR does not need to transmit. It simply listens. That keeps the RF side relatively approachable and avoids the additional design, certification, and interference concerns associated with building a transmitter.
3. A 915 MHz antenna
The tiny antenna bundled with an SDR may work during bench testing, but an antenna designed for approximately 915 MHz will usually provide more reliable reception. Keep the feed line short when practical, avoid placing the antenna immediately beside noisy power converters, and test several orientations.
Do not assume maximum gain is always best. A nearby sensor can overload a receiver when gain is excessive, while a distant unit may disappear when gain is too low. Start conservatively, watch packet reception, and adjust based on evidence rather than ceremonial knob turning.
4. A Raspberry Pi or another Linux computer
A Raspberry Pi 4 or 5 provides enough computing power for radio decoding, a small database, a local API, and a browser dashboard. It is more computer than a single sensor strictly requires, but that extra capacity is useful when the system also handles automation, additional radio receivers, backups, or historical visualization.
Power quality matters, particularly when a USB SDR is attached. Raspberry Pi recommends a suitable 3-amp USB-C supply for the Pi 4, while voltage loss in thin cables can create undervoltage problems even when the label on the adapter looks reassuring. A stable supply, short cable, and powered USB hub when necessary can prevent mysterious receiver resets.
5. Local backup power
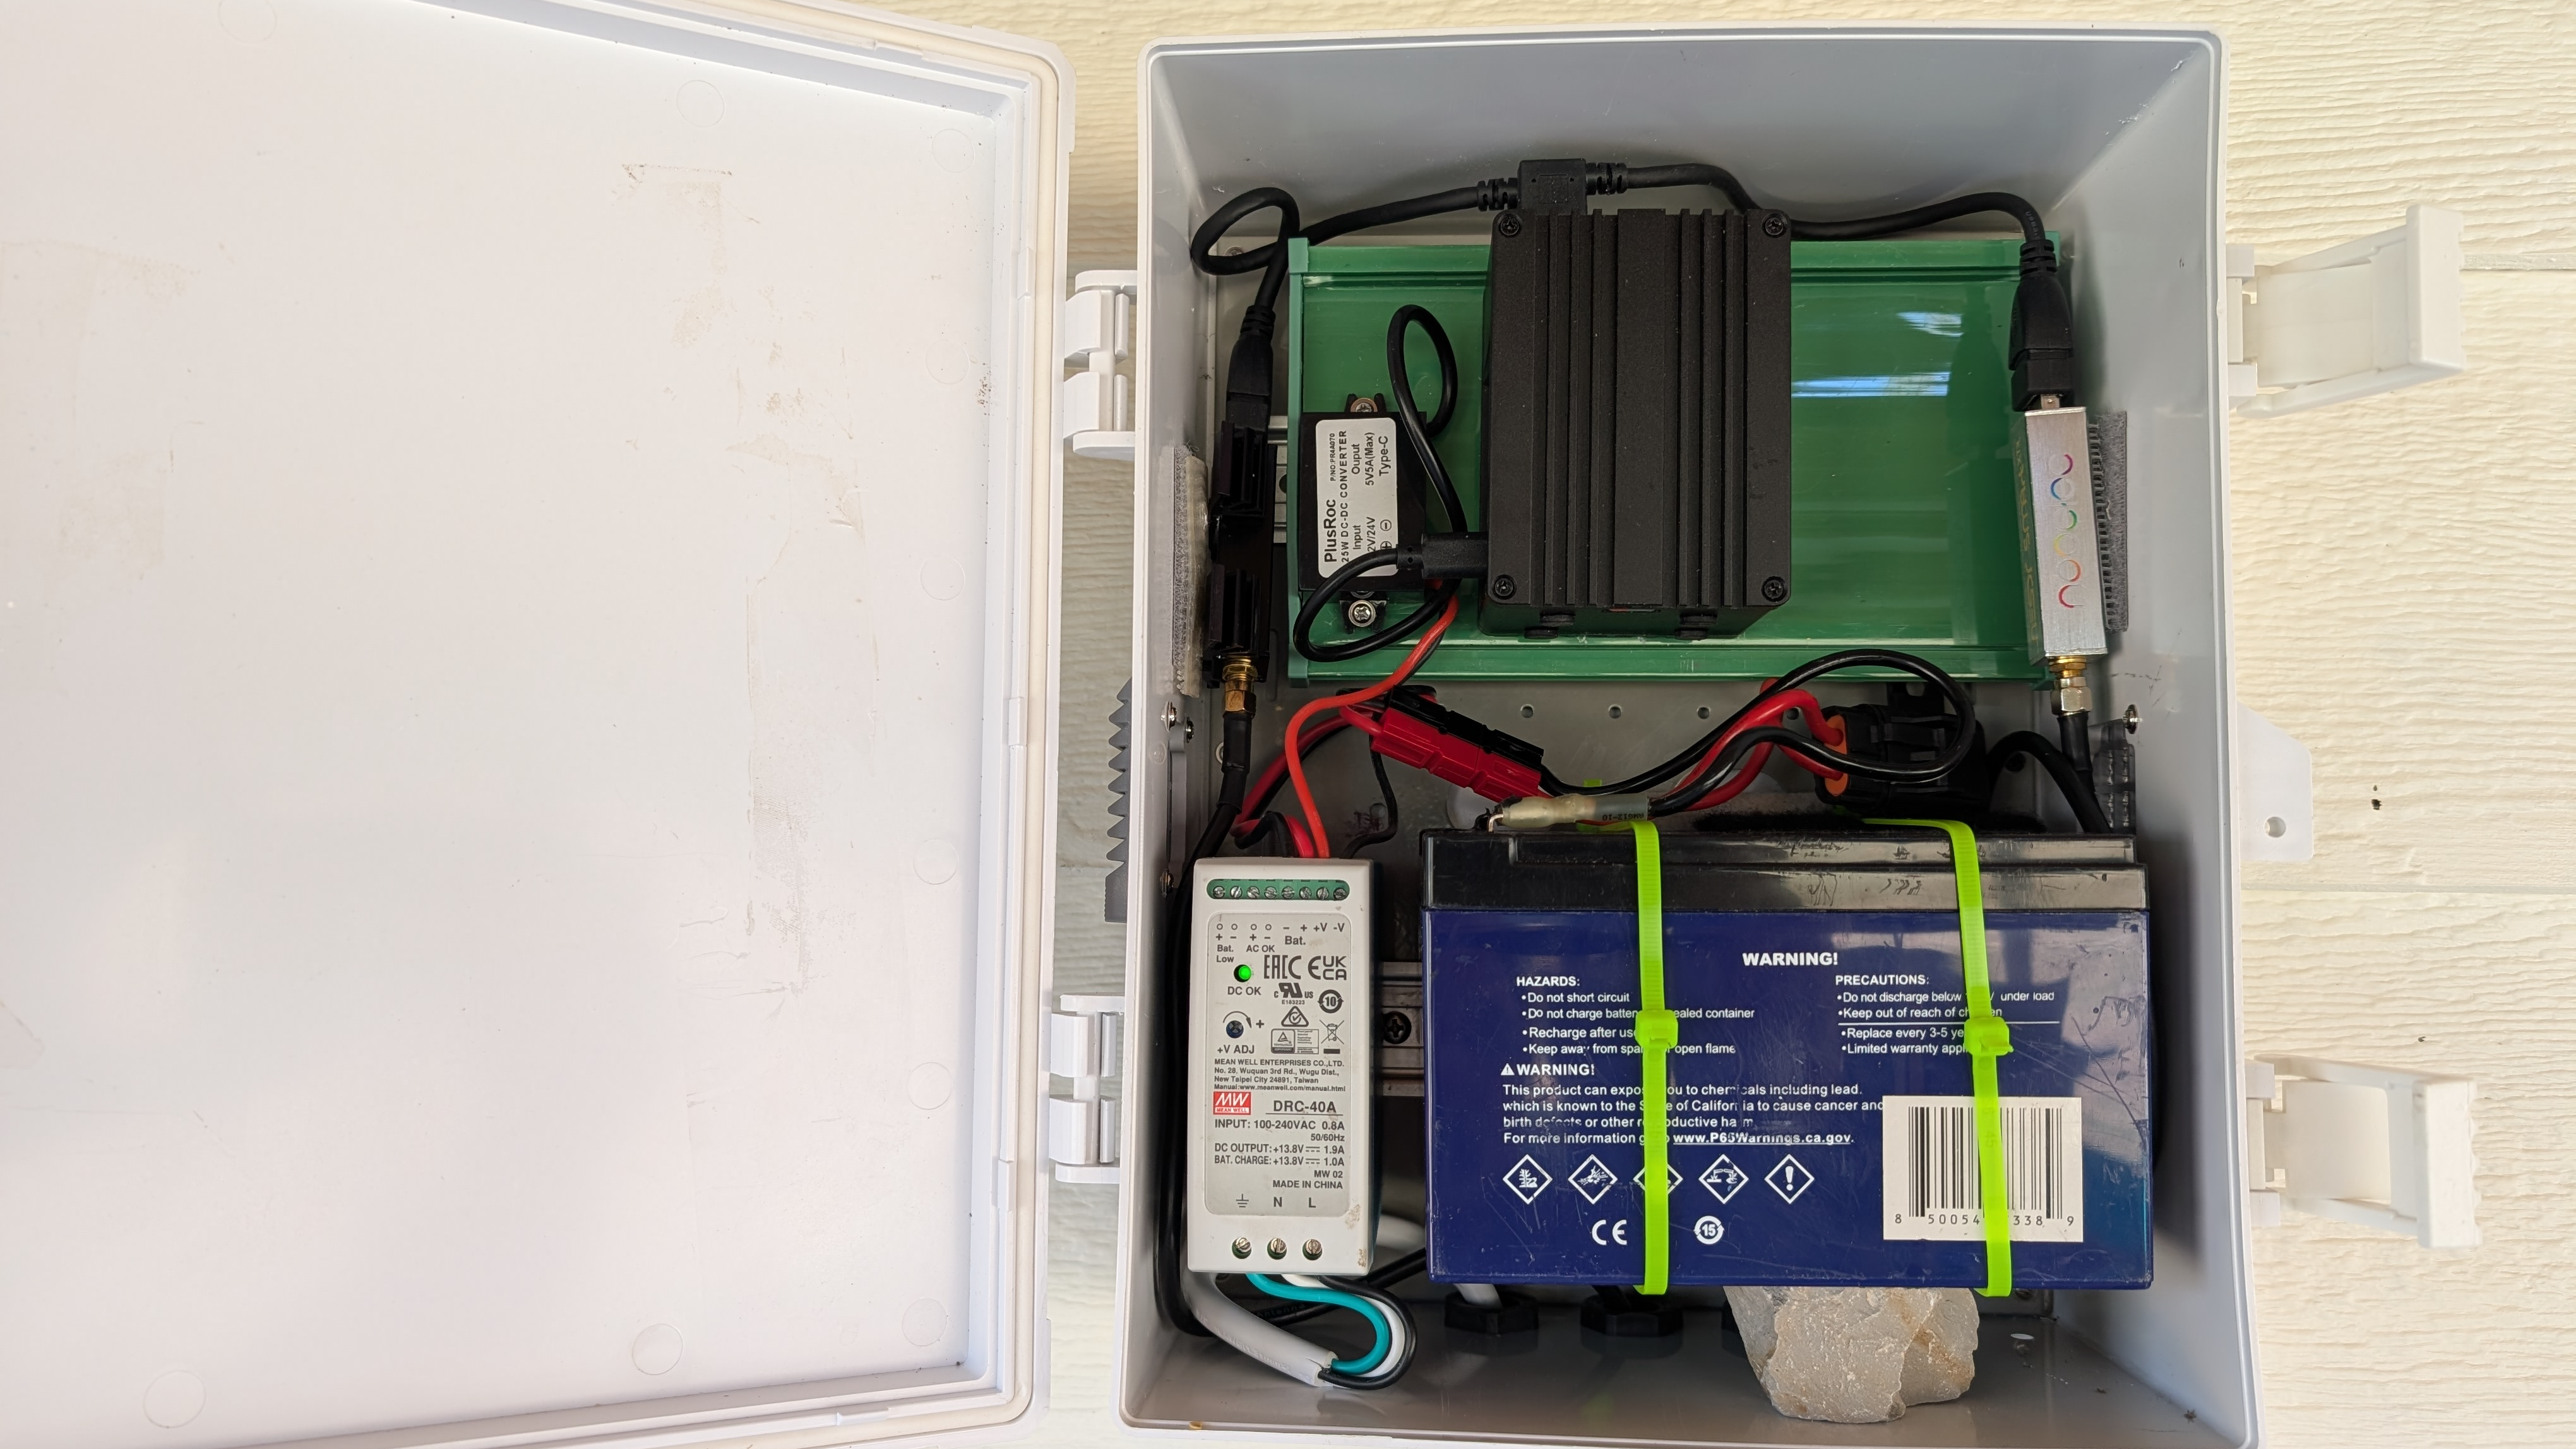
For an off-grid or outage-resistant installation, use a battery, charger, and regulated DC converter sized for the actual load. A weatherproof enclosure can house the computer, receiver, battery, and power electronics, but it must also manage heat and condensation. “Weatherproof” should not become “small solar-powered sauna.”
Measure consumption at idle and during USB activity before sizing the battery and solar panel. Leave a meaningful reserve for cloudy periods, cold-weather battery losses, aging, and conversion inefficiency.
How the Local Data Pipeline Works
Step 1: Capture the RF packets
The sensor broadcasts a compact packet every few seconds. The RTL-SDR tunes to the appropriate portion of the band and sends raw samples to the host computer. Ecowitt documentation for related WS90-based systems lists sub-10-second RF reporting intervals, while the documented offline project observes roughly five-second updates in its installation. Actual timing can vary by sensor revision and operating conditions.
Step 2: Decode the signal with rtl_433
rtl_433 supports a large collection of consumer sensor protocols across several ISM bands. Despite its name, it is not limited to 433 MHz. When configured with the correct center frequency and decoder, it can recognize WS90 packets, validate them, and output structured records containing measurements and device-health fields.
A simplified launch command may resemble:
The exact sample rate, gain, protocol number, and frequency may require adjustment. First confirm that the SDR is recognized with rtl_test. Then run rtl_433 interactively and watch for valid packets before building databases, dashboards, or a control room worthy of a low-budget science-fiction movie.
Step 3: Filter and validate the JSON
Your receiver may hear more than one device. Filter packets by model and sensor ID so the station does not suddenly display a neighbor’s temperature probe or a passing vehicle’s tire pressure as backyard humidity.
Validation should reject impossible or stale values. Check timestamps, packet integrity fields, sensor identity, battery status, and realistic measurement ranges. Record the time of the last valid packet and show a visible stale-data warning when updates stop. Repeating the last known value without labeling it can make a dead sensor look impressively calm.
Step 4: Convert snapshots into weather history
A raw packet is only a momentary observation. The backend must create useful state by tracking daily highs and lows, wind averages, gusts, rainfall changes, battery health, and missing-data intervals.
Rainfall deserves special care. A sensor may transmit a cumulative counter rather than “today’s rain.” The software records a baseline and calculates rainfall from the difference between consecutive valid values. It must also handle reboots, counter resets, rollover, duplicate packets, and day boundaries. The reference implementation reconstructs hourly, daily, weekly, monthly, and yearly totals from changes in the sensor’s running value.
Step 5: Store compact local records
Storing every five-second packet forever creates a large pile of nearly identical numbers. A practical design keeps recent high-resolution readings, rolling state, and summarized daily records. SQLite works well for a single-host station because it is lightweight, requires no separate database server, and can be backed up as part of the local filesystem.
The project architecture uses a checkpoint file for current rolling state and a small SQLite table for completed daily summaries. That design allows the dashboard to survive service restarts without turning a backyard weather station into a data-center internship.
Step 6: Serve a local dashboard
A backend API can return current conditions and history as JSON. A lightweight web server then serves HTML, CSS, and JavaScript to phones, tablets, wall displays, or computers on the LAN.
Keep the frontend simple. Display current temperature, humidity, wind, gusts, rainfall totals, UV, light level, battery status, last-packet time, and system health. Historical charts are useful, but system-health indicators are more important than decorative weather icons wearing tiny sunglasses.
Can an Offline Station Produce a Forecast?
A personal station primarily observes conditions at one location. A professional forecast uses regional surface observations, radar, satellites, upper-air measurements, numerical models, and meteorological expertise. Your Raspberry Pi is talented, but it is not secretly running the global atmosphere in the shed.
You can still add a limited local trend indicator. An indoor barometric sensor can calculate three-hour pressure tendency, while temperature, humidity, wind direction, and recent rainfall provide additional context. The National Weather Service defines pressure tendency over a specified period, commonly three hours, and notes that falling pressure can accompany approaching unsettled weather while rising pressure often follows improving conditions. However, pressure alone does not identify every front or storm.
Label the result honestly as a “local trend” rather than a full meteorological forecast. Examples might include:
- Pressure rising: Conditions may be stabilizing.
- Pressure falling slowly: A weather change may be approaching.
- Pressure falling rapidly: Monitor official forecasts and alerts.
- High humidity with falling pressure: Increased potential for clouds or precipitation.
An offline station should complement, not replace, official warning systems. A dedicated NOAA Weather Radio receiver remains valuable because the National Weather Service broadcasts forecasts and warnings continuously on seven frequencies from 162.400 to 162.550 MHz. That service is separate from your 915 MHz sensor receiver.
Sensor Placement Matters More Than Fancy Code
A perfectly decoded bad measurement remains a bad measurement. Nearby pavement can inflate temperature, buildings can block or accelerate wind, irrigated lawns can distort humidity, and roof mounting can produce impressive but unrepresentative heat readings.
Professional guidance generally favors temperature and humidity sensors over natural ground and away from artificial heat sources. Wind instruments should be elevated and separated from obstructions, while rain measurement requires exposure that minimizes turbulence and splash contamination. Residential properties rarely permit textbook-perfect placement, so document compromises and interpret the data accordingly.
Do not mount every instrument together merely because the manufacturer molded them into one attractive object. An all-in-one array is convenient, but the best position for wind is not always the best position for temperature or rain. Your goal is useful local consistency, not pretending the backyard has become an airport-grade ASOS installation.
Reliability and Troubleshooting
Watch for SDR disconnects
USB power instability, heat, driver conflicts, and aggressive gain settings can cause the receiver to disappear or stop decoding. Monitor kernel logs, packet timestamps, and service health. The project documentation reports occasional USB resets and describes reducing sample rate, using fixed gain, and limiting active decoders to reduce unnecessary load. These settings are hardware-specific, so test rather than copying values blindly.
Separate radio decoding from the dashboard
Run the RF listener, data engine, storage layer, and web interface as separate services. A dashboard update should not interrupt radio reception, and a temporary decoder failure should not corrupt historical records.
Containers are useful for isolating services, and Docker supports restart policies for automatically restarting processes. However, USB radio hardware can be less predictable inside a container. The reference project eventually moved rtl_433 onto the host after encountering receiver and USB reliability problems while keeping other components separated.
Back up state and test restoration
Copy the database and checkpoint files to another device on a schedule. More importantly, test restoring them. A backup that has never been restored is not a backup; it is a motivational file.
Use explicit health indicators
Track the last packet time, packets per hour, decoder restarts, database-write failures, free disk space, CPU temperature, battery voltage, and supply status. A small “data stale” warning provides more practical value than another animated cloud.
About of Hands-On Experience: What the Build Teaches You
The first lesson from assembling a local 915 MHz weather station is that the radio portion is usually less dramatic than expected. You plug in the SDR, choose a frequency, launch rtl_433, and wait. At first, the terminal may show absolutely nothing. This is the moment when every builder suspects the sensor, the antenna, the software, the USB cable, solar activity, and perhaps personal destiny.
The productive response is to simplify. Put the sensor close to the receiver. Verify the regional frequency printed on the hardware. Confirm that Linux can see the dongle. Stop other programs that might be claiming it. Run the decoder with broad diagnostic output. Once the first valid JSON packet appears, the project changes personality. It is no longer an RF mystery; it becomes a data-engineering problem.
That second phase is where most of the real work lives. A screen full of fresh temperature readings feels like success, but useful weather information requires memory. Daily highs must reset at the correct local midnight. Rain counters must survive reboots. Wind readings need smoothing without hiding genuine gusts. Missing packets must create warnings instead of flat, convincing-looking lines.
Rainfall is often the feature that exposes weak assumptions. During a test shower, a cumulative counter climbs normally. Then the service restarts, the baseline disappears, and the dashboard announces that twelve inches of rain fell during lunch. The fix is persistent state: save the last accepted counter, timestamp it, detect resets, and reject impossible jumps. It is not glamorous code, but neither is mopping the server enclosure.
Physical installation teaches another lesson: placement beats specification sheets. Moving an antenna a few feet can improve reception more than increasing gain. Relocating a temperature sensor away from sun-heated siding can change afternoon readings by several degrees. Raising the wind sensor above a fence can transform weak, chaotic measurements into a recognizable wind pattern.
Power testing is equally humbling. A system may run perfectly on a workbench and reset outdoors when the SDR warms up, the battery voltage falls, or a converter encounters a current spike. Logging undervoltage events and USB reconnects makes troubleshooting far faster than staring at a frozen dashboard and saying, “That is interesting,” which is engineering language for “I have no idea.”
The most satisfying moment comes during the first internet outage. Commercial apps stop refreshing, but the local dashboard continues updating every few seconds. Wind gusts appear, rainfall accumulates, and the historical graph remains available. The station is not merely disconnected from the cloud; it is independent of it.
Over time, the project also changes how you think about weather. You start noticing how rapidly humidity rises after sunset, how wind shifts before a front, how different storms produce different rainfall rates, and how much conditions vary from the nearest official station. The result is not a replacement for professional forecasting. It is something more personal: a reliable record of what the atmosphere actually did in your own yard.
Conclusion
Building an offline 915 MHz weather station is a practical way to combine radio, Linux, local networking, databases, and environmental sensing. A compatible outdoor array broadcasts the measurements, an RTL-SDR captures the packets, rtl_433 turns them into structured data, and a Raspberry Pi stores and presents the results without requiring an internet service.
The strongest design is not necessarily the one with the most containers, charts, or sensors. It is the one that produces believable measurements, survives reboots, identifies stale data, protects its historical records, and continues working when external services disappear.
Start with reliable packet reception. Add persistent state. Install the sensors thoughtfully. Monitor power and system health. Then expand carefully into pressure trends, irrigation automation, wall displays, or optional data sharing. Before long, you will have something commercial cloud stations rarely provide: a weather system that belongs completely to you.