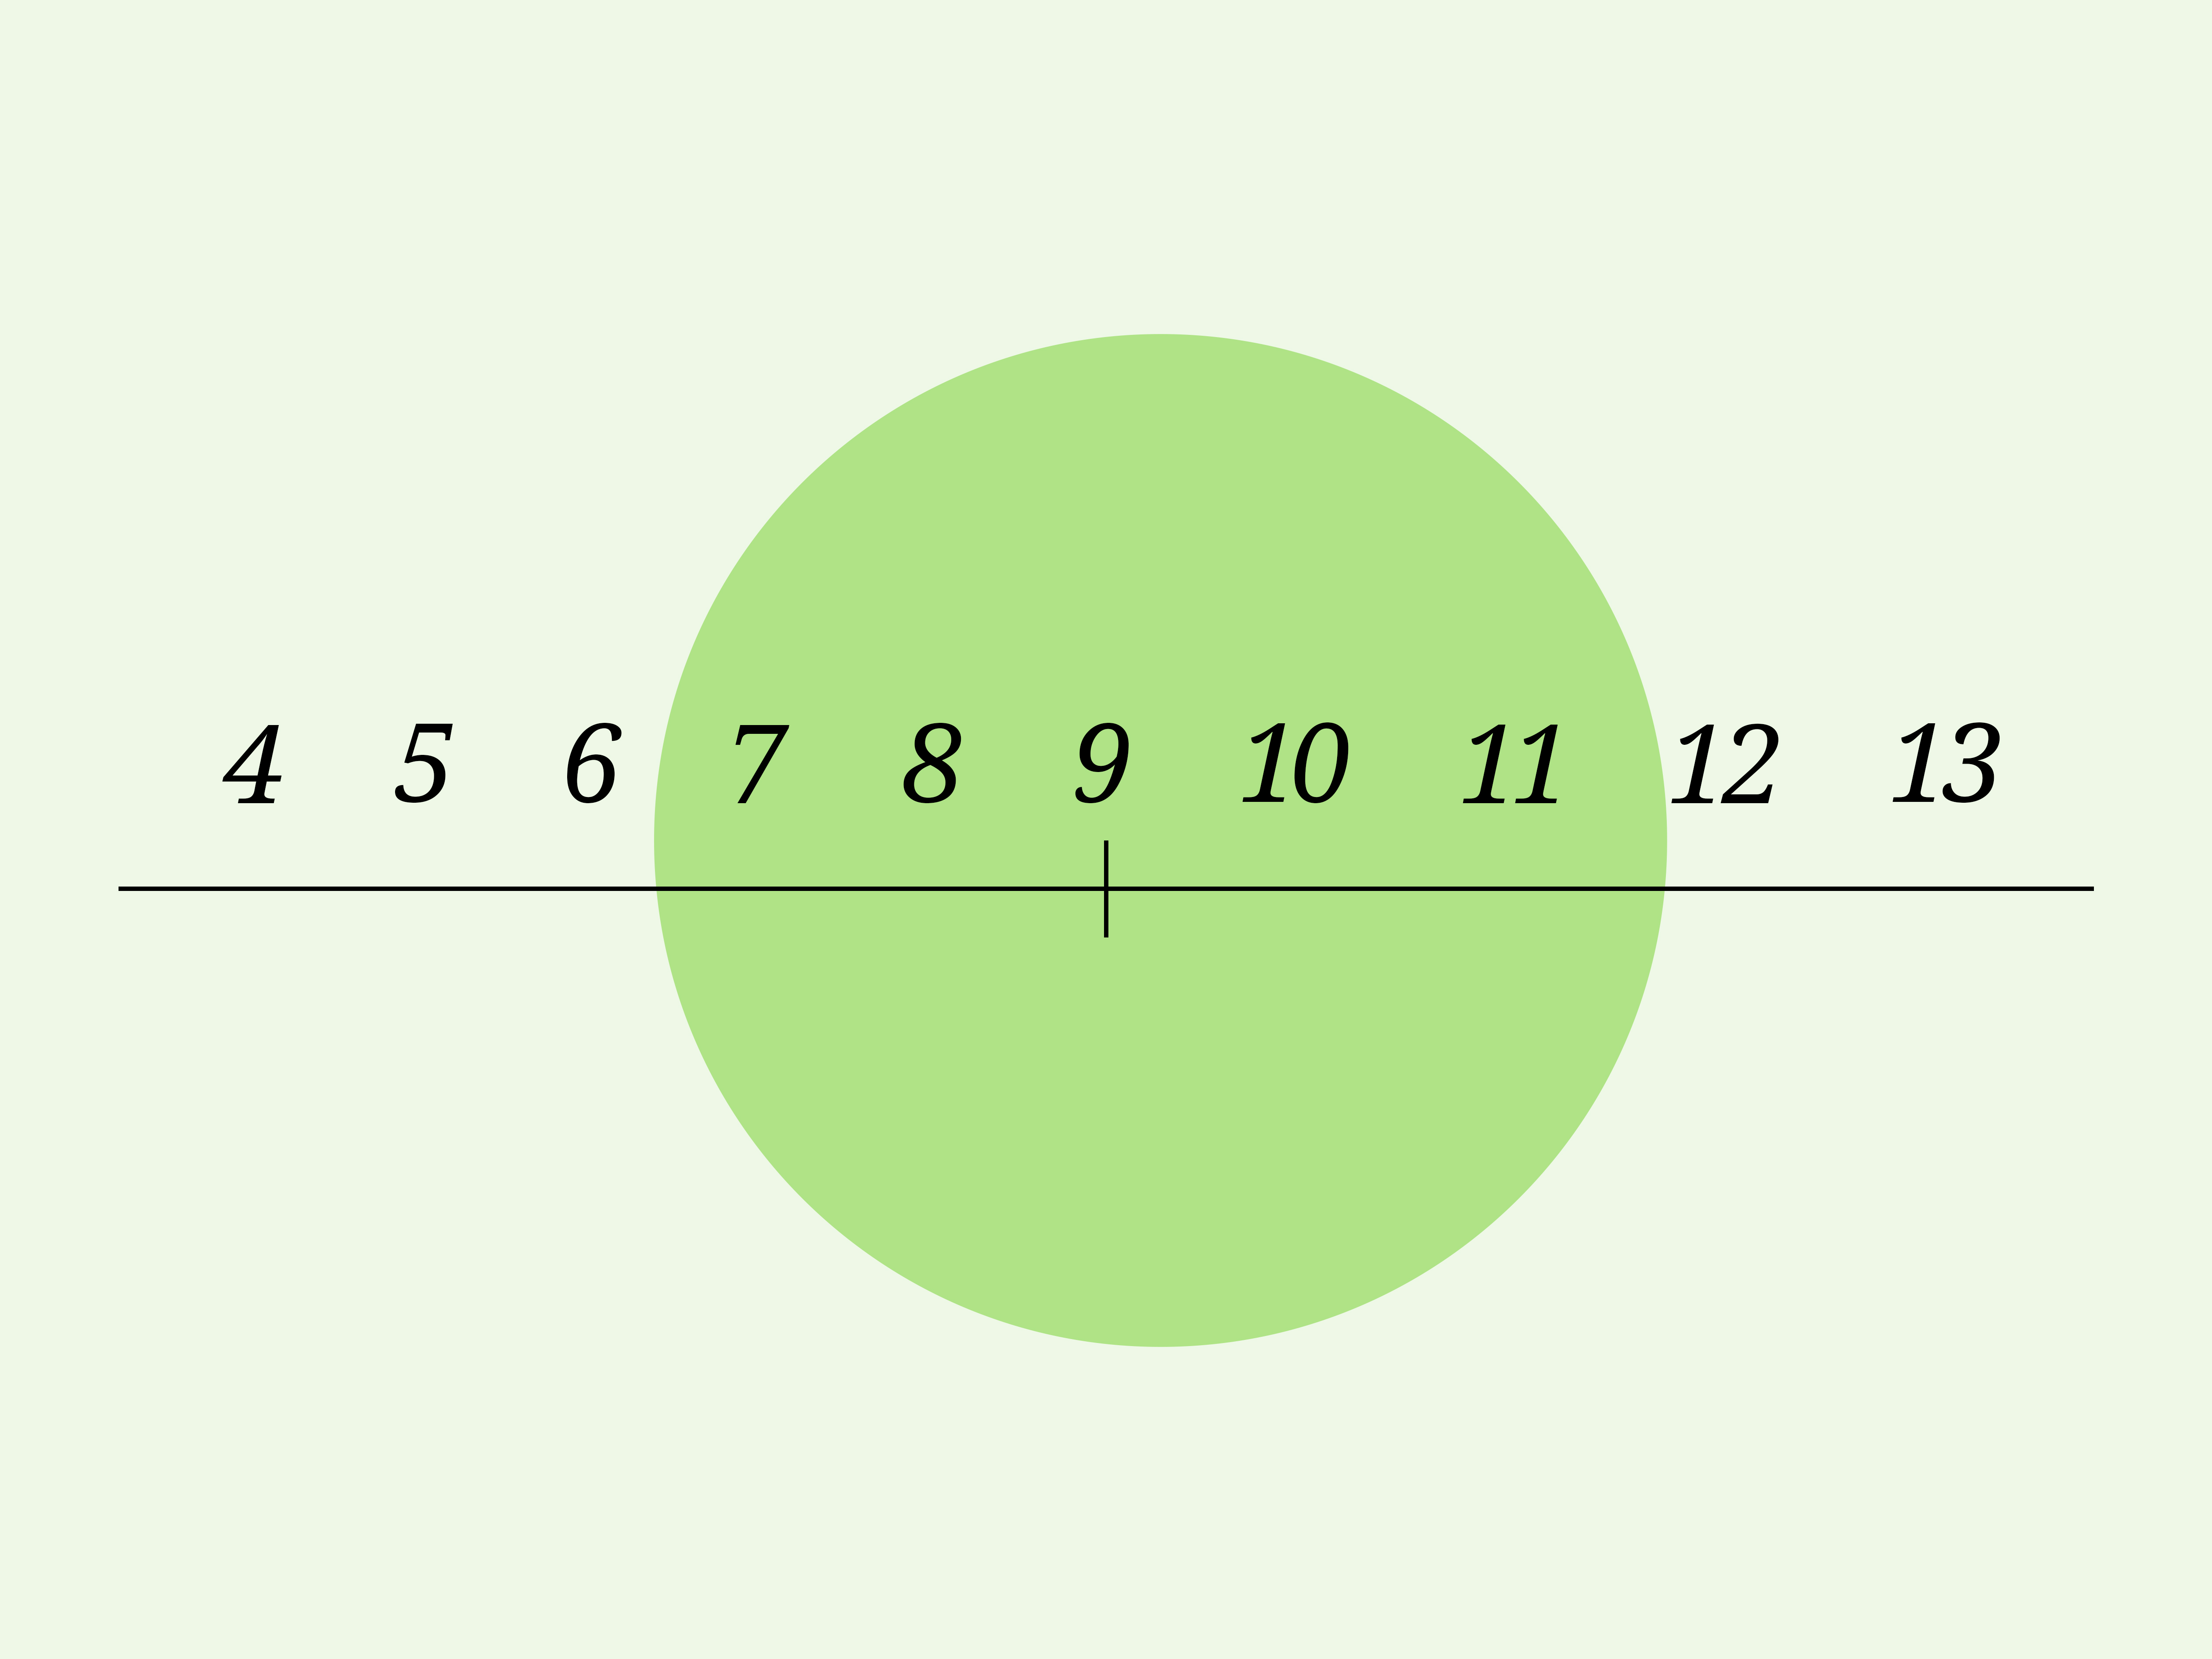
Statistics can sound like a secret language invented by people who enjoy making students nervous. But some ideas are surprisingly friendly once you invite them in for coffee. Mean deviation about mean is one of those ideas. It helps answer a simple question: How far, on average, are the values in a data set from their mean?
For ungrouped data, the calculation is direct. You do not need class intervals, frequency tables, or advanced formulas wearing tiny graduation caps. You only need the original values, their arithmetic mean, and the absolute distance of each value from that mean.
In this guide, you will learn what mean deviation about mean means, how to calculate it step by step, how to avoid common mistakes, and why this measure of dispersion is useful in real life.
What Is Mean Deviation About Mean?
Mean deviation about mean, also called mean absolute deviation about the mean, is a measure of spread. It tells you the average absolute distance between each observation and the arithmetic mean of the data set.
In simpler words, it measures how much the data values usually differ from the average value. A small mean deviation means the data points are close to the mean. A large mean deviation means the data points are more spread out.
For example, imagine two students both have an average score of 80. Student A scores 78, 80, 82, and 80. Student B scores 60, 100, 75, and 85. Their averages may look similar, but their consistency is very different. Mean deviation helps reveal that difference.
Mean Deviation About Mean Formula for Ungrouped Data
For ungrouped data, the formula is:
Mean Deviation About Mean = Σ|x – x̄| / n
Where:
- x = each individual observation
- x̄ = arithmetic mean of the data
- |x – x̄| = absolute deviation from the mean
- Σ = sum of all values
- n = number of observations
The absolute value symbol is important. It means negative signs are ignored. Whether a value is above or below the mean, its distance from the mean is treated as positive. After all, distance does not walk backward.
Why Do We Use Absolute Values?
If you subtract the mean from each value, some deviations will be positive and some will be negative. If you add them directly, they cancel each other out. In fact, the sum of deviations from the mean is always zero.
That is mathematically neat but practically useless when measuring spread. Absolute values solve the problem by turning every deviation into a positive distance. This allows us to measure the total amount of variation in the data set.
Steps to Calculate Mean Deviation About Mean
Step 1: Write the Ungrouped Data Clearly
Ungrouped data means raw data values are listed individually. For example:
Data set: 4, 6, 8, 10, 12
These values are not arranged into groups or intervals. Each number stands on its own, proud and slightly nervous.
Step 2: Find the Arithmetic Mean
Add all the values and divide by the number of observations.
Mean = (4 + 6 + 8 + 10 + 12) / 5
Mean = 40 / 5 = 8
So, the arithmetic mean is 8.
Step 3: Find the Deviation of Each Value from the Mean
Subtract the mean from each observation:
| Value (x) | x – x̄ |
|---|---|
| 4 | 4 – 8 = -4 |
| 6 | 6 – 8 = -2 |
| 8 | 8 – 8 = 0 |
| 10 | 10 – 8 = 2 |
| 12 | 12 – 8 = 4 |
Step 4: Convert Deviations into Absolute Deviations
Now ignore the negative signs:
| Value (x) | |x – x̄| |
|---|---|
| 4 | 4 |
| 6 | 2 |
| 8 | 0 |
| 10 | 2 |
| 12 | 4 |
Step 5: Add the Absolute Deviations
4 + 2 + 0 + 2 + 4 = 12
Step 6: Divide by the Number of Observations
Mean Deviation About Mean = 12 / 5 = 2.4
So, the mean deviation about mean is 2.4. This means the values in the data set are, on average, 2.4 units away from the mean.
Another Example: Calculating Mean Deviation About Mean
Let’s use a slightly more realistic example. Suppose a student records the number of minutes spent studying math over six days:
30, 45, 50, 35, 60, 50
Find the Mean
Mean = (30 + 45 + 50 + 35 + 60 + 50) / 6
Mean = 270 / 6 = 45
Calculate Absolute Deviations
| Study Time | |x – 45| |
|---|---|
| 30 | 15 |
| 45 | 0 |
| 50 | 5 |
| 35 | 10 |
| 60 | 15 |
| 50 | 5 |
Sum of absolute deviations = 15 + 0 + 5 + 10 + 15 + 5 = 50
Mean Deviation About Mean = 50 / 6 = 8.33
The student’s study time differs from the average by about 8.33 minutes per day.
How to Interpret Mean Deviation About Mean
A mean deviation value is not just a number to decorate your notebook. It tells a story about consistency.
If the mean deviation is low, the data values are tightly packed around the mean. If the mean deviation is high, the values are more scattered. In school marks, a low mean deviation may show consistent performance. In daily temperatures, a high mean deviation may show unstable weather. In business sales, it can show whether revenue is predictable or bouncing around like popcorn.
Mean Deviation About Mean vs. Standard Deviation
Both mean deviation and standard deviation measure spread, but they do it differently.
Mean deviation uses absolute values. Standard deviation squares the deviations, averages them, and then takes the square root. Because standard deviation squares differences, it gives more weight to extreme values. Mean deviation is often easier for beginners to understand because it keeps the idea of “average distance” very clear.
However, standard deviation is more commonly used in advanced statistics, probability, finance, research, and data science because it has powerful mathematical properties. Mean deviation is excellent for learning, quick comparison, and intuitive interpretation.
Common Mistakes to Avoid
Forgetting Absolute Values
This is the classic mistake. If you add normal deviations, positive and negative values cancel out. Always use absolute deviations when calculating mean deviation.
Using the Wrong Mean
Mean deviation about mean must use the arithmetic mean, not the median or mode. Mean deviation can also be calculated about the median, but that is a different version.
Dividing by the Wrong Number
For ungrouped data, divide by the total number of observations. Do not divide by the sum of values or by the number of deviations that are nonzero.
Rounding Too Early
If the mean is a decimal, keep enough digits during the calculation. Rounding too early can change the final answer, especially in longer data sets.
When Is Mean Deviation About Mean Useful?
Mean deviation about mean is useful whenever you want a simple and readable measure of variation. Teachers can use it to compare test score consistency. Coaches can use it to study player performance. Small businesses can use it to compare daily sales. Students can use it to understand how spread out values are before moving into variance and standard deviation.
It is especially helpful when explaining data to people who do not want a statistics lecture with dramatic background music. “The values are about 8 units away from the average” is easier to understand than many more complex statistical statements.
Quick Practice Problem
Find the mean deviation about mean for the data set:
5, 7, 9, 11, 13
Mean = (5 + 7 + 9 + 11 + 13) / 5 = 45 / 5 = 9
Absolute deviations:
|5 – 9| = 4
|7 – 9| = 2
|9 – 9| = 0
|11 – 9| = 2
|13 – 9| = 4
Sum of absolute deviations = 4 + 2 + 0 + 2 + 4 = 12
Mean deviation about mean = 12 / 5 = 2.4
Experience-Based Tips for Learning Mean Deviation About Mean
When students first learn how to calculate mean deviation about mean, the formula can look more complicated than the actual process. In real classroom experience, the best way to understand it is to stop memorizing the formula for a moment and think of the data points as people standing at different distances from the average. The mean is the meeting point. Mean deviation tells us how far everyone has to walk, on average, to reach that meeting point.
One helpful habit is to organize every calculation in a table. Many errors happen because students try to do all the arithmetic in one long line. A simple table with columns for the original value, deviation from the mean, and absolute deviation keeps the work clean. It also makes mistakes easier to spot. If the final answer looks suspicious, you can check each row instead of hunting through a messy jungle of numbers.
Another practical tip is to use real data from everyday life. Instead of practicing only with random textbook numbers, try calculating mean deviation for your daily screen time, weekly study hours, basketball scores, walking steps, or monthly spending. Real data makes the concept less abstract. When you discover that your study time varies by 12 minutes per day or your daily steps vary by 1,500 steps, the number suddenly means something.
It also helps to compare two data sets with the same mean. For example, one set may be 8, 9, 10, 11, 12 and another may be 2, 6, 10, 14, 18. Both have the same mean, but the second set is clearly more spread out. Calculating mean deviation makes that difference visible. This is one of the best “aha” moments in learning statistics: the average alone does not tell the whole story.
Students should also remember that mean deviation is not about judging whether values are good or bad. It simply measures distance from the mean. A higher mean deviation does not always mean something is wrong. In some situations, variation is normal or even useful. Sales may vary because weekends are busier. Temperatures may vary because seasons change. Test scores may vary because topics have different difficulty levels.
Finally, do not rush the absolute value step. That small pair of vertical bars is doing serious work. It prevents negative and positive deviations from canceling out. If you forget it, your answer may become zero, which would falsely suggest that the data has no spread at all. That is like saying a roller coaster is flat because the ups and downs balance out. Technically creative, but definitely not correct.
Conclusion
Mean deviation about mean for ungrouped data is one of the clearest ways to understand variability. It shows the average distance between each value and the arithmetic mean. To calculate it, find the mean, subtract the mean from each value, take absolute deviations, add them, and divide by the number of observations.
This method is simple, visual, and useful for students, teachers, business owners, researchers, and anyone who wants to understand how spread out a data set is. While standard deviation is more common in advanced statistics, mean deviation remains a powerful learning tool because it explains variation in plain language.